How I teach population size controls without PowerPoint
- Christian Moore Anderson

- Sep 8, 2023
- 8 min read
Updated: Jul 22, 2025
After reading about stock and flow diagrams in my book, many people have asked for more details about how I actually go about building them with students. In this blog I'll give an example but it's important to remember that in an adaptive classroom, the flow of the lesson builds according to the particular interactions that occur between students and teacher. This example could be considered a skeleton to be fleshed out in the moment, but do see this other post which shows another way of using them.
If students haven't seen a system dynamics model before
In this case, I begin with a model of a bathtub. This establishes the analogy—students can use their understanding of the flow and accumulation of water to understand other less-tangible phenomena.
I always begin with a stock, which is where stuff accumulates. I draw a square and state that it is a bathtub, then I add the inflow and outflow. I ask students how water comes into a bath and leaves. While trivial, we'll rely on this understanding to build other models, so I want to make this bit explicit. I then ask students how the rates of flow into and out of the bath could be regulated. The tap for the inflow is obvious, while students may discuss the orientation of a plug to regulate the out flow.

So far, so good. I'm making explicit a key concept—rates of flow. The next key concept is recognising how rates of inflow and outflow determine how much water accumulates in the bath tub. So I ask three questions and have students vote by raising their hands:
What if the inflow rate is higher than the outflow rate, what happens to the volume of water in the tub?
What if the inflow and outflow rates are equal?
What if the inflow rate is lower than the outflow rate?
The three options they can vote on are: The volume of water increases, decreases, or stays the same.
My students invariably get this 100% correct. And this is the great power of these models. Students pull on very intuitive understandings of water to model more complex things.
If you have more time to explore these models, then you could add a feedback loop and maybe test the assumption in a practical activity. As the tub fills with water, so does the pressure, which, in turn, increases the rate of outflow.
Building a model of population feedback controls
If my students are familiar with these models, then I begin here. And, for most of my models—which are qualitatively drawn—this is the basic order of things but which can be done with flexibility. I have used this model with 13-14 year-olds.
Start with a stock

In this case the stock is the number of individuals in a population and I remind students of the connection of these models to bathtubs.

Identify the inflows and outflows.
It's important to remind students that what flows through a tube is what also accumulates in a stock. If water accumulates in a tub, then water must be flowing through the tubes.
If individuals are accumulating in a population, what must be flowing through the tubes? I put these questions to the class and ask them to identify what the "taps" would be. In my simplified model (not including migration), the tap of the inflow is "births" and the tap of the outflow is "deaths".

This is an important step as it requires making several distinctions. Distinguishing is key to model making. When you ask students what affects a population size, they suggest things like food availability. This is a factor to be included in the model, but we need students to distinguish between what directly increases & decreases an accumulation—the rate of births & deaths—and what is an indirect factor that affects the rate of these flows.
Even after taking the step to make explicit that what flows through the tubes is what accumulates, students fall into this trap. And this is just a normal step towards understanding these models. They have to make these distinctions to think more powerfully, and by falling into the trap and receiving feedback on the error, they're more likely to learn the distinction.
Identify the factors that affect the inflows and outflows
Next, I may ask students to discuss in pairs the factors that affect the birth and death rates. When I collect their ideas, the most common answers are food availability, predator populations, and disease. With less frequency students suggest that weather is a factor, and the availability of mates (this latter point can be summarised as the population size itself is a factor).
What factors are included will determine the model. Once you've accepted a few responses from students, you can ask them how many factors are enough. Should we include everything we know? This is a great opportunity to remind students of the purpose of models—simplifying complex problems to make the mentally tractable.

We could, of course, include more factors and quantify the model—mathematical models help move beyond the limitations of our cognition. However, while Jon Darkow creates quantitative models with his students (i.e. it's certainly possible), it's not something I yet fit into my courses and something I'm only a beginner with.
Identify the relationships between the factors
The next step is the key to understanding this model, but in general isn't too hard for students. I typically ask them to discuss it in pairs before I ask for ideas. The convention is to describe relationships as positive or negative. I include this notation in my models so students get used to it, but I find students understand better when we describe relationships as "same" (positive), or "opposite".
I typically ask students for the relationship and it's direction. So I'd expect a student to say which "tap" a factor affects, and whether the relationship is "same" or "opposite". To get a view of what the class are thinking as a whole, whenever ideas are offered I ask the class to vote—by raising their hands—if they agree with the idea or not.
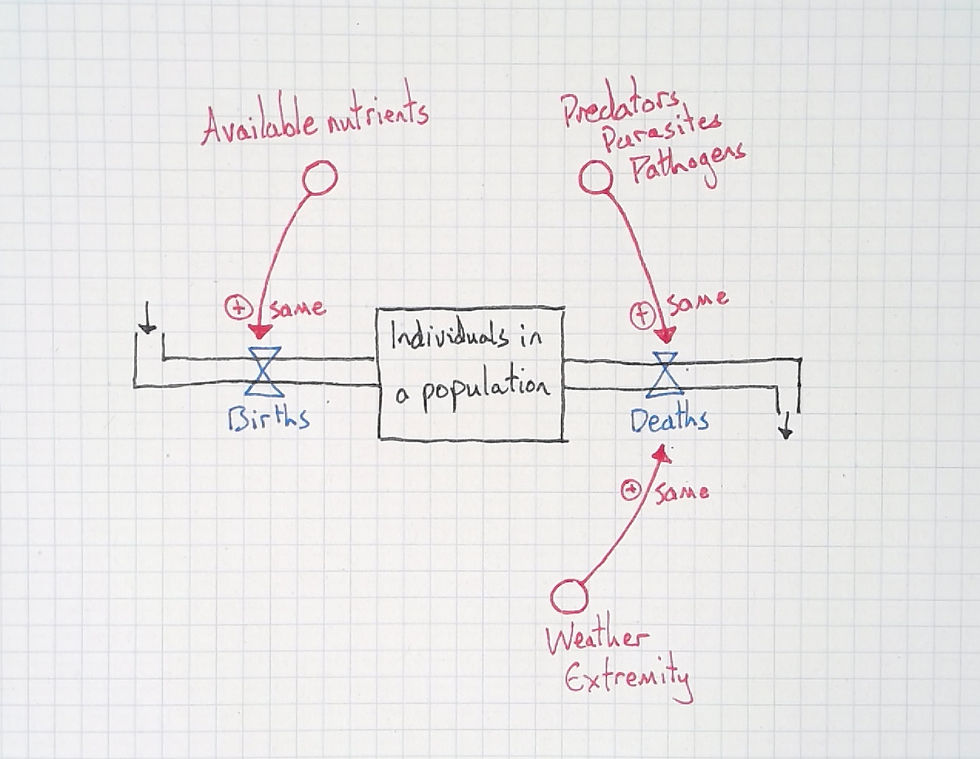
At this point, I'll ask students: So, what affects the availability of nutrients? And the same with the other factors. Again, I may give students a minute to share ideas in pairs before I pick people to answer.
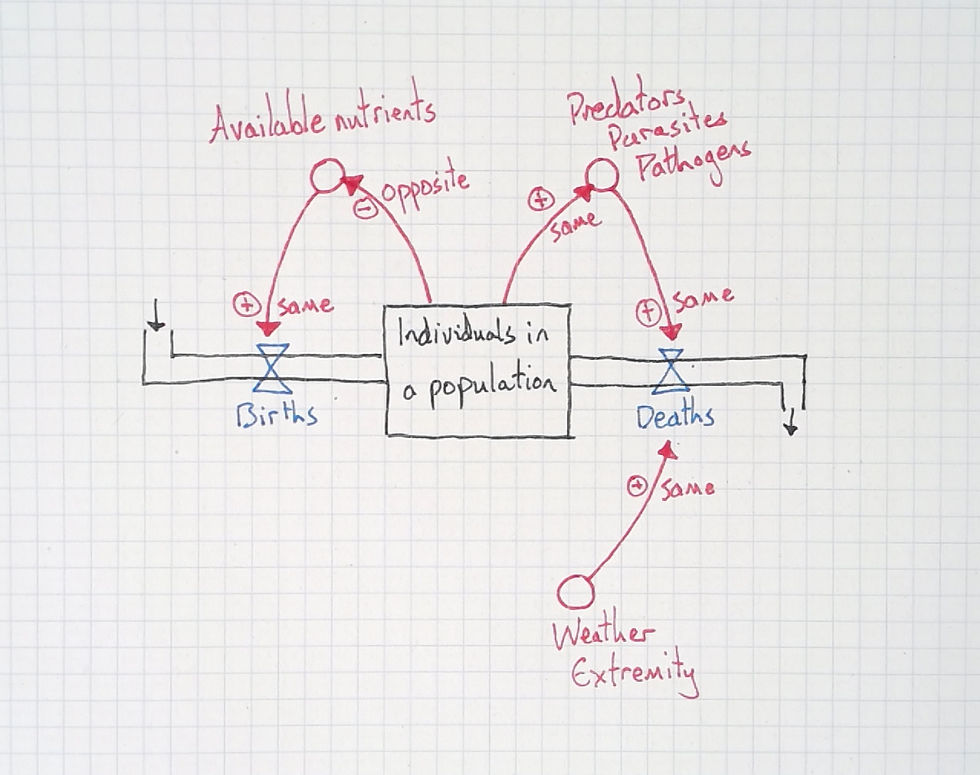
Now the feedback loops are complete, but for students who are still learning to "see with" these models, and to "think with" circular causality, I make it explicit. To do this, I just follow the causal relationships while asking the class for their effect. For example:
What does a rise in birth rate cause? (rise in population size)
What does a rise in population size cause? (less available nutrients)
What does a decrease in available nutrients cause? (lower birth rate)
So, a rise in birth rate ultimately comes back round to cause itself to be lowered again. That's a balancing (negative) feedback loop. Something I make explicit to students. I would also do the same with any other feedback loop. But with "weather extremity" it's different. And it's this difference that helps put the feedback loops into light.
I ask students, what affects the weather extremity? They realise that nothing in the model does so. I ask, does a rise in population size cause more, or less, extreme weather? So, then, I ask, what's the difference between the factors at the top of the model and "weather extremity"? Students typically say something like "the weather doesn't depend on the population, but the others do". And here I suggest the labels of density dependent and independent.
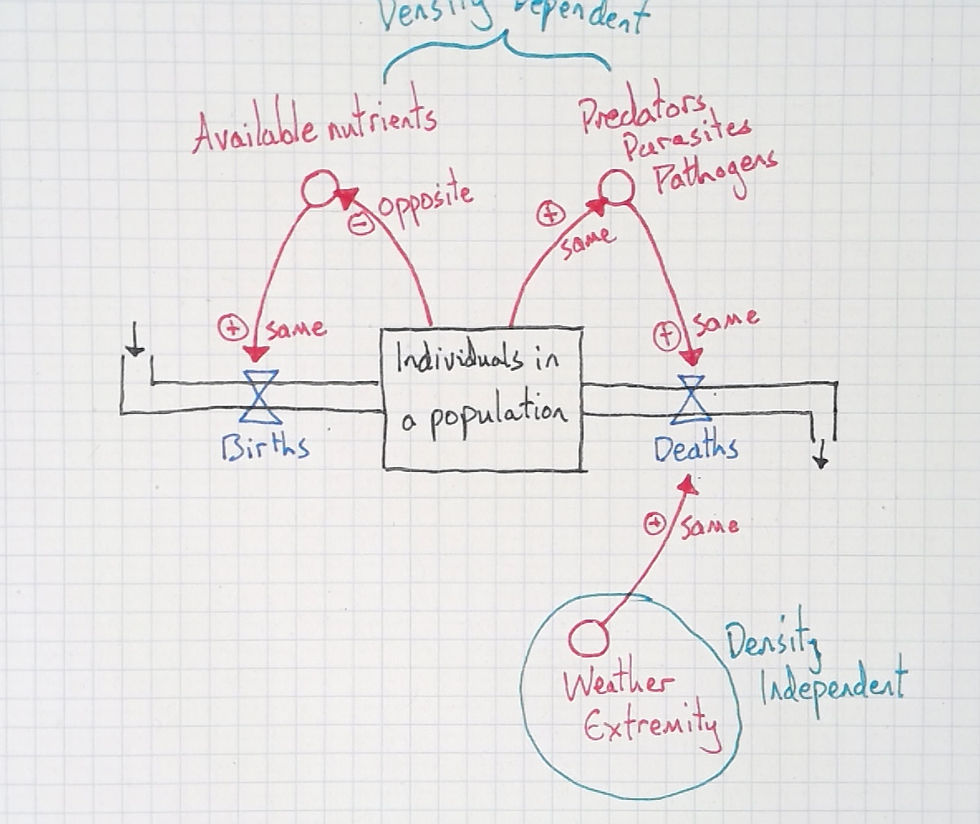
Depending on your students and curricular needs, you could easily expand this model without it getting overly complex. For example, the factor available nutrients could be connected to deaths with an "opposite" relationship. This helps include famines into the model (such as seasonal scarcities of food).
You could also connect the stock directly to the taps. A larger population will see more births, as well as deaths. This connection is helpful if students suggest that natural disasters and extreme weather can decrease the birth rate (if deaths increase, and the population six falls, there will be less births). By adding this relationship it makes their model coherent.
Have students think with the model
If students are going to understand the model, and be able to think with it, they must practice using it. The first question I typically ask is to predict the population size over time on sketch graph. Like this:
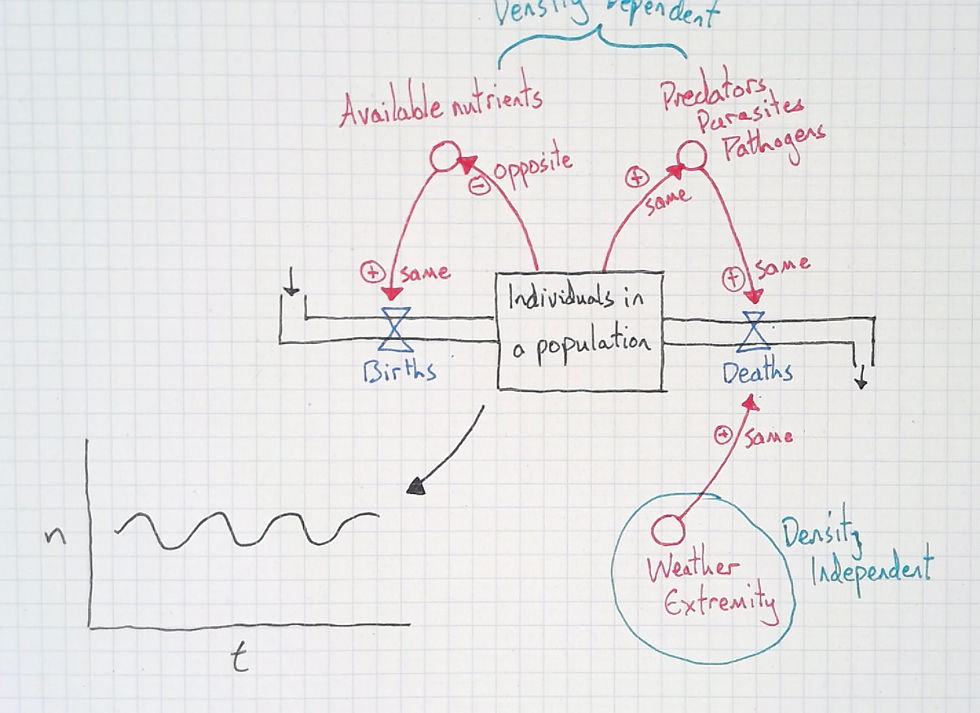
After this, I may ask them about situations in a food chain. One particular example I like students to explore is an example from certain areas in Spain. Private land is used for hunting, and in these lands predators are excluded while deer are feed surplus grain. The deer then just graze and browse everything in the area such that there are no young trees, just those that were tall (and old) enough to escape the deer when it all began.
So I draw a food chain and as what would happen if the predator were to go extinct. As a second question, I ask what would happen if surplus food were given, but in two different situations. Firstly, if the species were endangered, and secondly, if it weren't. I tell students that their answers must come from thinking with the model we've made and that I expect their answers to mention the steps in the mechanism they think about—not just an outcome.
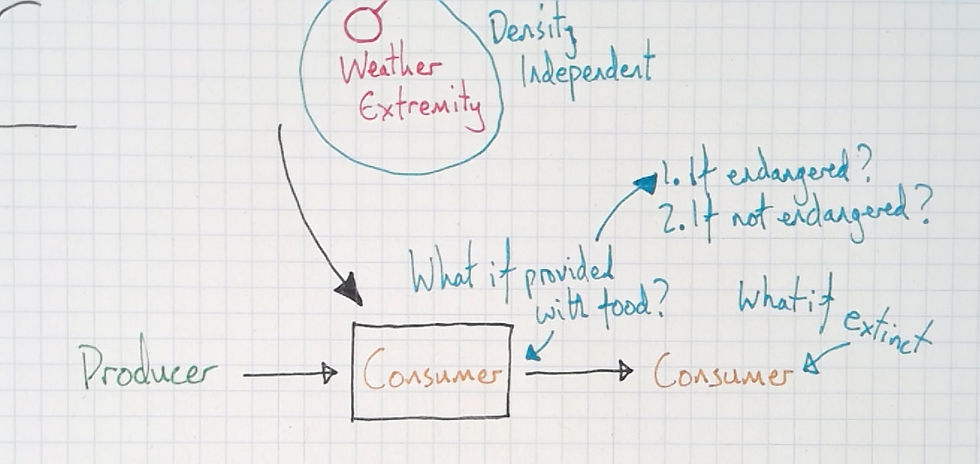
I let students discuss these ideas in pairs. But if I hear anyone say something like "The producers will go up", I'll challenge them to say how that would come about, mentioning the causal relationships in the model. They may then say something like "Ok, so if the predators went extinct, they'd be less deaths, which means that the herbivores would go up. And if there's more of those, then... ah... Yeah." as they realise their mistake. This is the importance of mechanistic answers, ones that include the steps in the process.
The second question refers to the deer. If given surplus food, they'll browse everything away while maintaining a high population size as they are released from the feedback loop involving available nutrients. The example with endangered species is interesting. If a small population is "helped" with some extra nutrients, their population size may get large enough that the balancing feedback loop causes it to plummet once more. Something the conservation effort was supposed to avoid.
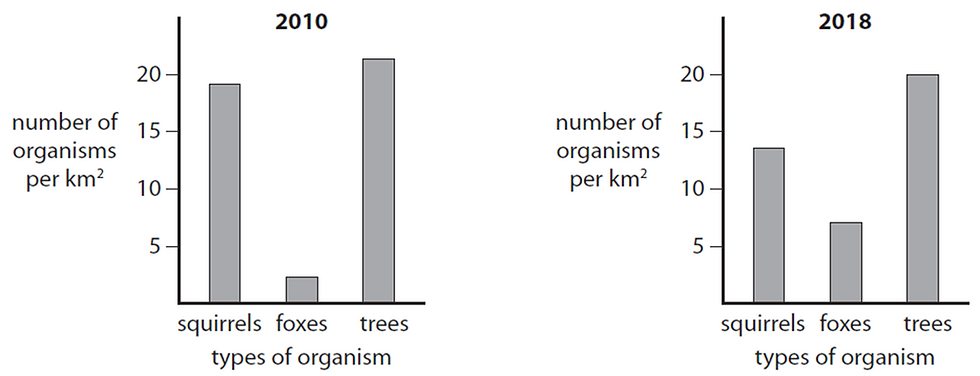
Students can also use the model to answer typical exam questions, such as this one from the Edexcel IGCSE Biology course: The graphs show the number of squirrels, foxes and trees in a woodland in 2010 and in 2018.
Discuss possible reasons why there is a decrease in the number of squirrels from 2010 to 2018.
Use information from the graphs and your own knowledge in your answer.
Finally, a powerful example to discuss is humans. Why is it that the human population does not oscillate but continue to rise. Students are quick to see how medicine, vaccines, and the extinction of large mammals, has released us from this balancing feedback loop. At the same time, ever more intense fishing practices and fertiliser use has also released us from the other feedback loop.
This is a great opportunity to explore the paradox discussed by Gregory Bateson, that the more we try to control nature, the less we can (Chaney 2018). As, "One of the major fallacies ... is the premise that it is possible to have total control over an interactive system of which oneself is a part" (Gregory Bateson cited in Harris-Jones, 1995). Do you want to co-construct meaning without lecturing, slide decks, or leaving students to discover for themselves? Learn how and why in my books. Download the first chapters of each book here.
References
Chaney, A. 2018. Runaway: Gregory Bateson, the Double Bind, and the Rise of Ecological Consciousness. The University of North Carolina Press.
Harris Jones, P. 1995. A Recursive Vision: Ecological Understanding and Gregory Bateson. University of Toronto Press.


