How I teach the nitrogen cycle (without PowerPoint)
- Christian Moore Anderson

- Jun 1, 2024
- 5 min read
Updated: Jun 9, 2025
The nitrogen cycle is one of my favourite lessons. There's so much to connect to: history and everyday life. But, students need a clear model to understand what's going on, lest it be abstract and meaningless. Here's I've taught it with by drawing a model step by step following the principles from my book Difference Maker. You can read about the benefits of teaching without PowerPoint here.
I'll show you two models. One for 16–18 and one for 14–18. In this post, I describe how I built the model in a lesson with my 16–18 year olds, while the model for 14–18 can be found at the end.
I began by drawing the stocks without any flows.
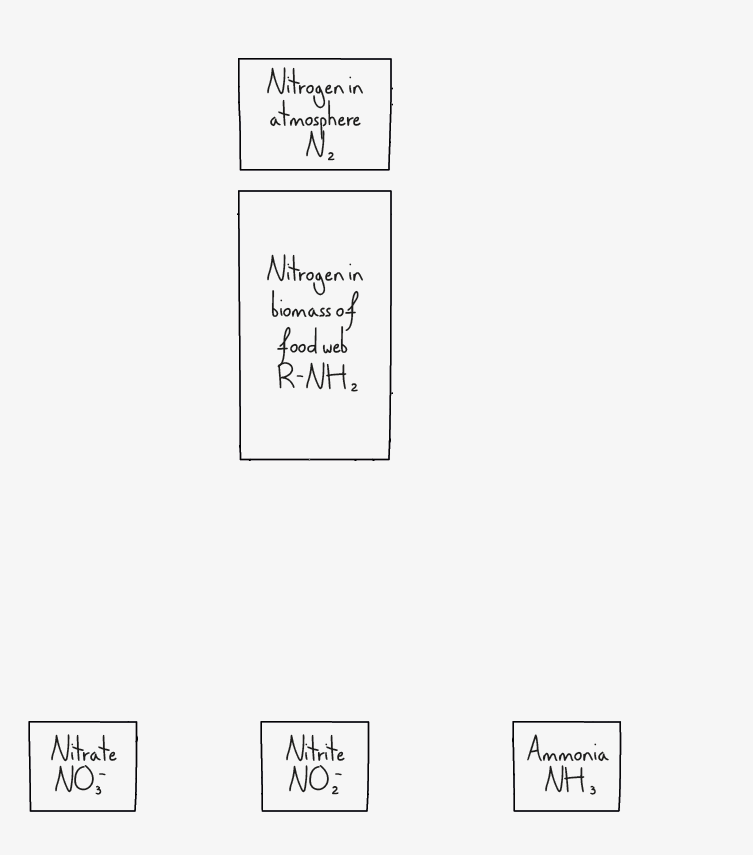
I designed this model to be spatially intuitive for students: where nitrogen can be physically found at any one time. This splits the nitrogen cycle into three main domains:
the atmosphere
the biomass of food webs, and,
the soil
I named the stocks and began telling students about the problems ecosystems face. I started with the nitrogen flow from the atmosphere into the biosphere.
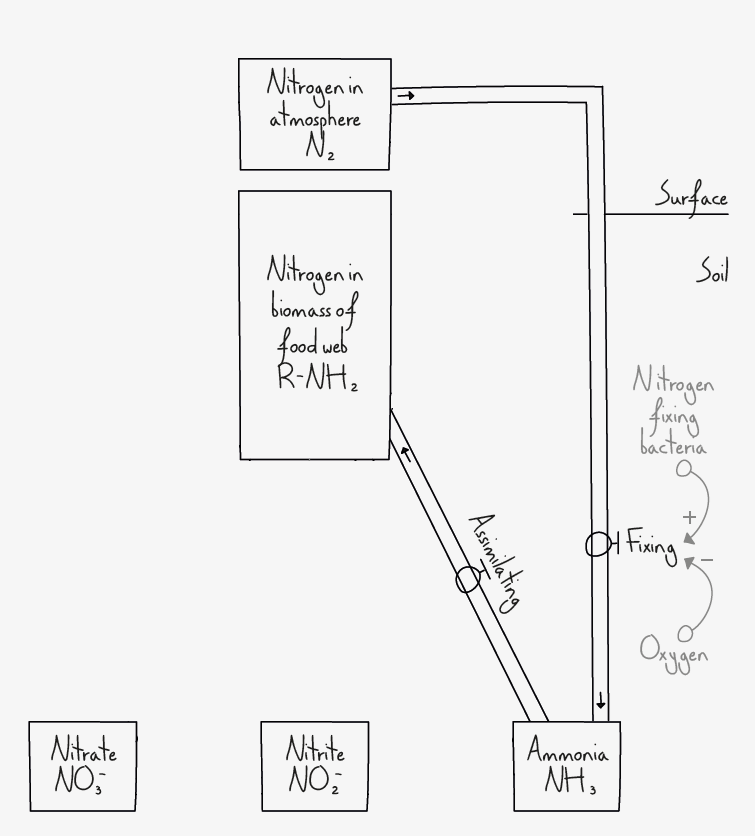
Nitrogen is a crucial element of amino acids and nucleotides. Organisms need to accumulate it, but most is stuck in the atmosphere. Diatomic nitrogen (N₂) is very stable gas and requires work to force it to form part of another molecule (to fix it). Only certain species can fix nitrogen, and those are bacterial.
This is a bottleneck for ecosystems, as the rate of flow of nitrogen fixation determines the input of nitrogen to the whole ecosystem.
I added the flow from atmospheric nitrogen to the stock of ammonia.
I drew the flow of plants “assimilating” the ammonia.
I explained how the price of food correlates with nitrogen content. We discussed some examples: doughnuts are cheap (being mainly fats and carbs), and meat is expensive (with high amino acid content). Raubenheimer and Simpson (2020) suggest that animals continue to eat until they have accumulated their daily nitrogen budget; an essential variable of homeostasis. This could go some way to explaining why humans can easily overeat on carbs and fats.
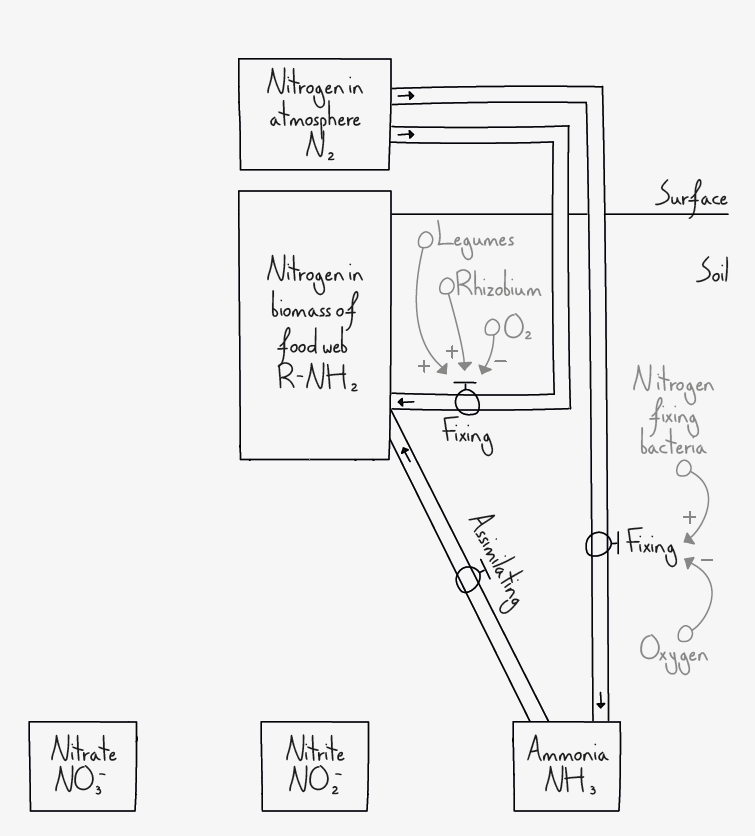
I asked the students if they knew of any plant-based food high in protein. Some of them mentioned legumes, and we discussed examples such as lentils, chickpeas, peas, peanuts, soy beans, and broad beans. I showed them an image of legume root nodules and explained the symbiotic relationship between the plants and Rhizobium bacteria.
I then drew the other flow of nitrogen fixation and added the variables that affect it. This completed the two flows of fixing nitrogen.
It was time to put these flows into historical context. Increasing human population sizes required increased flows of nitrogen. Every ancient agricultural civilisations had at least one legume in its repertoire.
For example, in the Americas, the Aztecs farmed climbing beans, and the Incas grew peanuts; the Middle East sowed lentils and chickpeas, the East tended mung beans and soybeans. Africa cultivated the black-eyed pea.
Legumes, of course, form an essential part of vegetarian and vegan diets. I also told the students about cover crops, such as legumes, which fix nitrogen while a field is not in use. This raises the nitrogen content of the soil before cultivation begins.
Next, I discussed the processes of nitrification that ultimately convert ammonia into nitrates. I explained to students that plants would assimilate ammonia, but in high concentrations, it is toxic, making nitrate the preferred form.
The flow rate of nitrogen into the food web is, again, limited by bacterial action.
I added the flows of nitrifying and assimilating (of nitrate), and discussed the rates.
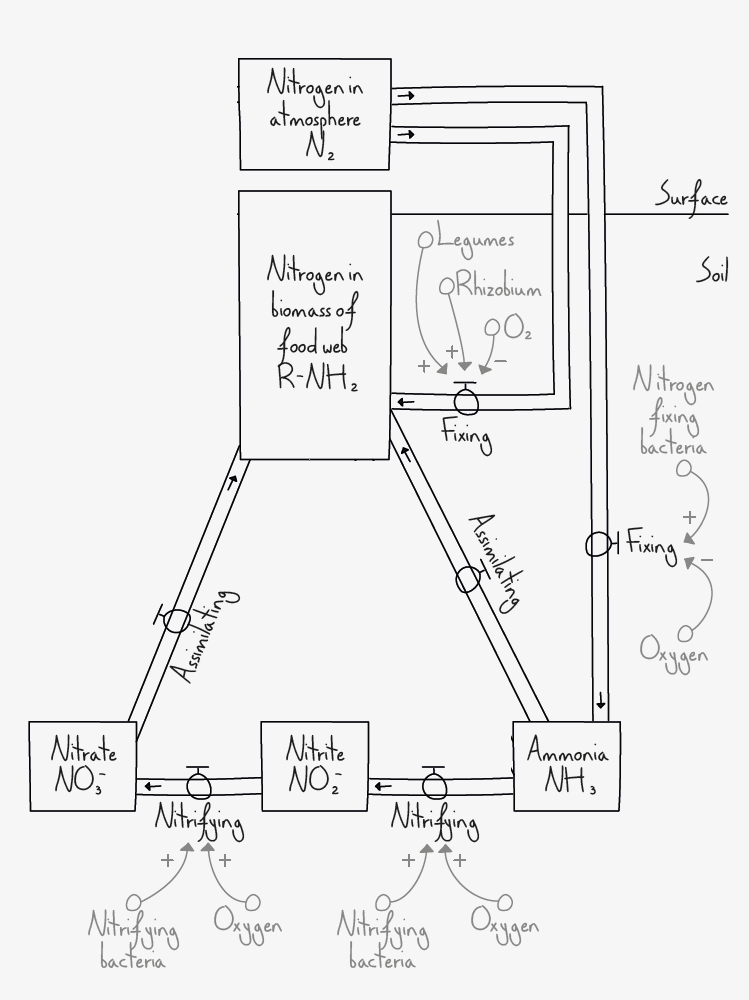
I contrasted fixation with nitrification as fixation requires low oxygen concentrations. Legumes produce leghaemoglobin (which captures oxygen like haemoglobin) to protect their bacterial symbionts.
Nitrification, however, requires oxygen and can be limited by low concentrations. This can happen, for example, in waterlogged fields. A well-aerated soil, therefore, can increase nitrification rates.
Here I paused to return to the historical context. Industrial nations that wanted to feed and increase their population needed to consider the soil nitrate concentrations. Gorman (2013) tells this story well. Hundreds of years ago, in England, it was the law that the manure found in stables belonged to the monarch, and a team of people was charged with collecting it.
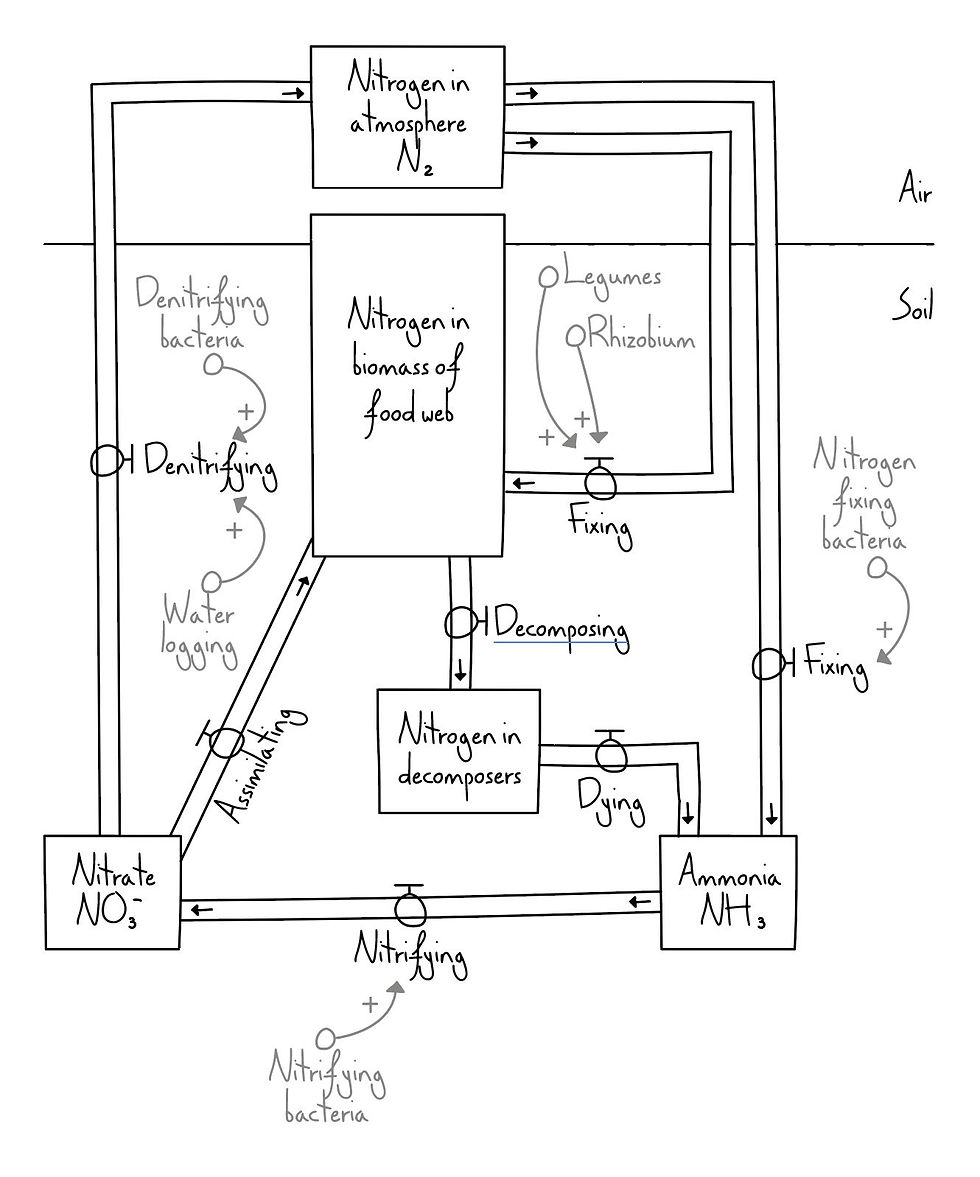
I added the ammonifying flow that returns nitrogen from the food web to ammonia. Ammonification is related to decomposition and represents the completion of nitrogen cycling within ecosystems. (This step is represented differently in the model for 14–16 shown at the end of this post)
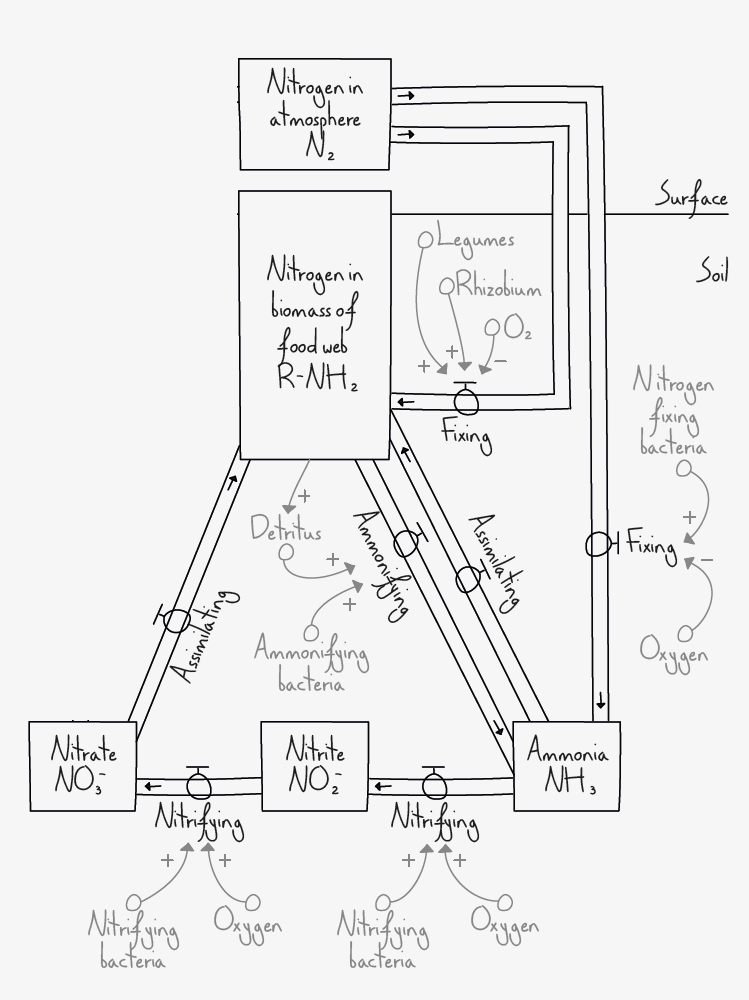
I discussed with students that these flows are typically much faster than the inputs and outputs to ecosystems. Therefore, ecosystems act as accumulators of nitrogen. However, collecting manure wasn’t enough. As population sizes increased, inputs to the system also had to increase to sustain the growth.
Islands in the pacific off Chile and Peru, which had accumulated nitrogen-rich bird poo for milenia, suddenly became hot property—enhancing tensions between those countries. Europe and America imported huge quantities.
The Atacama Desert became a lucrative resource. It’s the driest desert in the world. Over millions of years, ocean water sprayed across the desert, never to be washed away by rain. There was an input but no output, so huge deposits of minerals accumulated. These deposits were exported to feed populations abroad.
But, as demand outstripped supply, the Haber process was invented to industrially fix nitrogen and produce artificial fertiliser (and munitions). Through this process, humans have duplicated global nitrogen flows.
I added the denitrification flow and the variables that affect it.
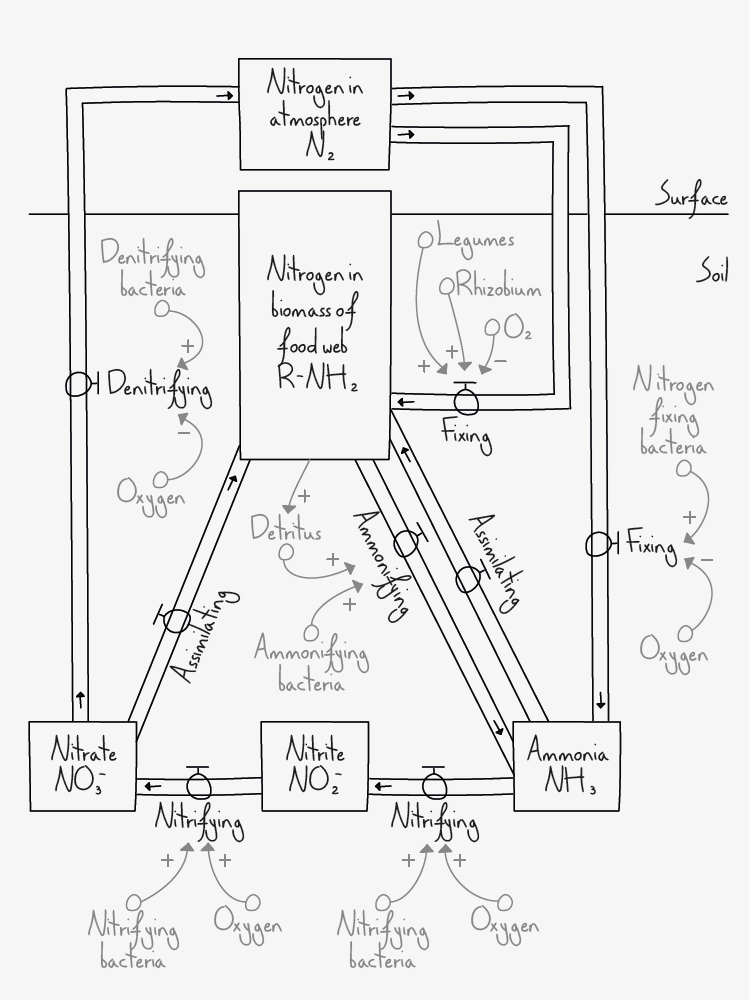
Not only can waterlogging reduce nitrate production (decreased inflow), but an absence of oxygen also increases the rate of denitrifying nitrates (increased outflow). With low oxygen levels, less nitrogen will flow into the nitrate stock, while more nitrogen will flow out.
I gave the example of swamps, which retain hardly any nitrogen. This is the reason carnivorous plants evolved to obtain nitrogen from insects (while still acting as autotrophs).
It was now time to have students grapple with potential variation in the system. This is a key principle of the variation theory of learning.
To do this, I asked them all the things they could think of doing if they were a farmer. The answers I expected and discussed were avoiding the waterlogging of fields to decrease rates of denitrification, spreading manure over fields to increase the rate of decomposition, growing legume cover crops (like clover), and applying nitrates directly to the soil.
I finished the lesson by showing and discussing with the students a graph of the human population and an estimate of what it would be had the Haber process not been invented.
Below, I'll leave you the simplified version I've used with my 14-16 year olds. Learn how and why to teach this way in Difference Maker.
Age of students I have used this model with: 14–16
References
Gorman, H. 2013. The Story of N: A Social History of the Nitrogen Cycle and the Challenge of Sustainability. USA: Rutgers University Press.
Raubenheimer, D., & Simpson, S. 2020. Eat Like the Animals: What Nature Teaches Us About the Science of Healthy Eating. USA: Houghton Mifflin Harcourt.


